

Diagram in the Reports > N fluxes tab
Reports > N fluxes
In this tab, a diagram is created in which the N flows are displayed on a field in a calendar year. Shown are the temporal changes of N in plants and Nmin in soil, as well as the course of N mineralization from organic soil matter, crop residues and organic fertilizers.
Positive values show an inflow of mineral nitrogen into the soil, negative values show an outflow. The estimated Nmin values are the sum of all estimated inflows and outflows.
This diagram serves as a graphical plausibility check of the user entries in the diary. The values are estimates based on very simple estimation methods and therefore may differ significantly from reality.
Attention: N in plants and N mineralization of crop residues are only valid for plants that have been fertilized according to our recommendations. That is, these values are also displayed if there is N deficiency on the field and the plants can not take up N in reality.
Green dots in the graph mark Nmin analyzes. Tip: Place the mouse pointer on a green dot to get more information about the Nmin analysis.
To create the diagram:
- Select Farm, Field and Sub field
- enter the calendar year
- click Filter to select which data to display
- click Create to create the diagram
The diagram become clearer if you switch the program window to full screen mode before clicking on Create. - click Export to save the graphic as a PDF file.
- The right part of the screen displays messages that explain the diagram or indicate special features. Click the i icon to see more information about a message.
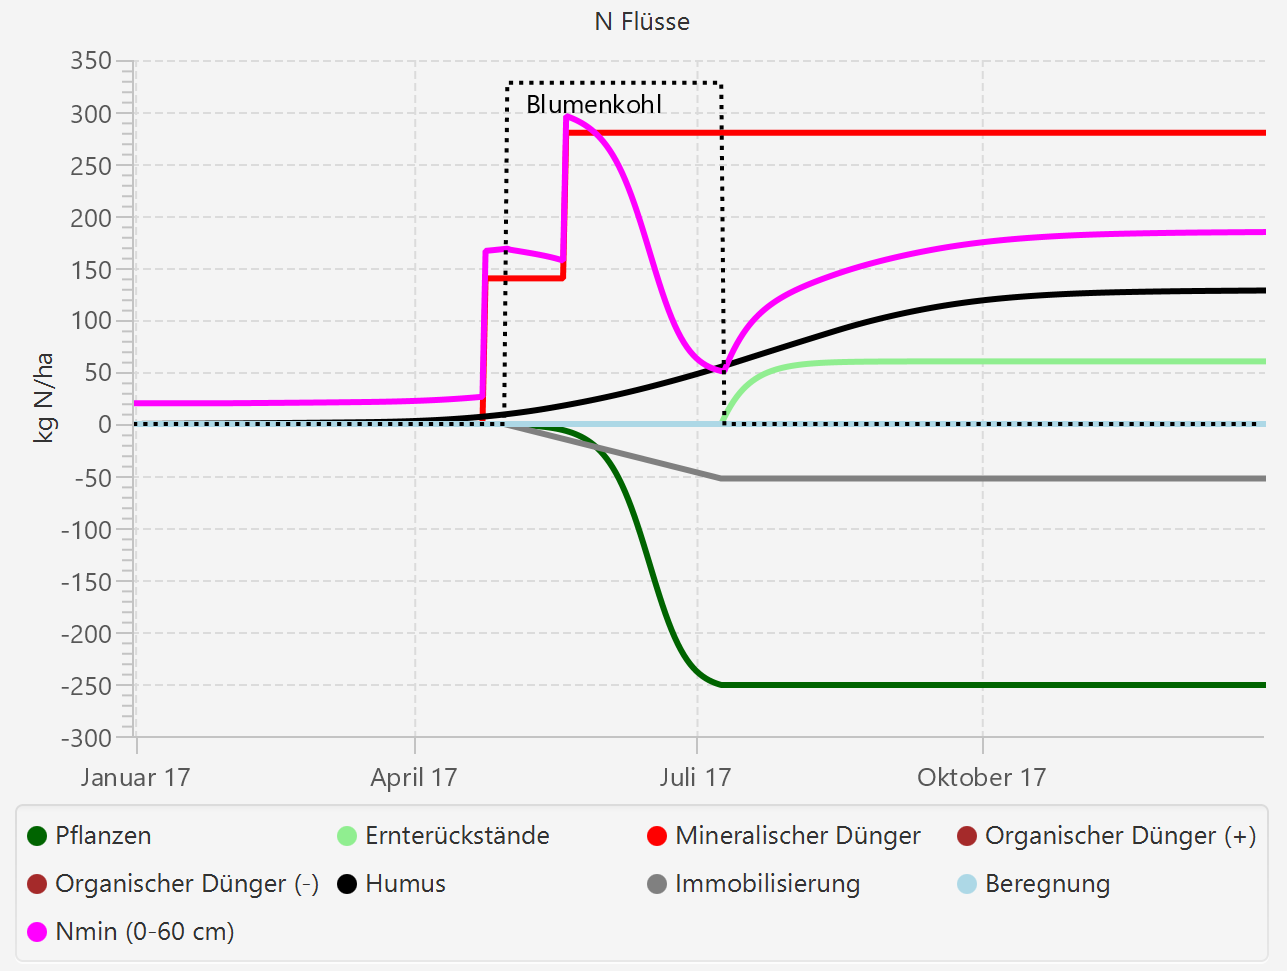
The diagram below shows a simple example: Two mineral fertilizer applications of 140 kg N/ha each (red line) initially increase soil mineral N (Nmin) in 0 to 60 cm (pink). By N uptake of the plants (dark green) and immobilization (gray) the Nmin value then decreases again. After the end of the cauliflower crop, the Nmin value increases as a result of the N mineralization of humus (black) and crop residues (light green). From the beginning of October, the Nmin value increase only slightly, as the mineralization of the crop residues is completed and the mineralization of humus – due to the low soil temperatures – is low.
Plants can only pick up N from the soil layers they have reached with the roots. In N-Expert, both the estimated temporal course of the root growth and the maximum rooting depth is taken into account, for example 30 cm for lettuce, 60 cm for cauliflower, 90 cm for Brussels sprouts.
Entering an Nmin analysis result overrides the estimate for the soil sample day. Thereafter, the estimate is continued based on the analysis result.